As people go about their day to day lives they are creating data, always. Changes in body temperature, credit card usage, opening the refrigerator all create data. This data operates in what some have called the data shadow we know the data is there but it’s difficult to grasp.
However, in recent years the reduced cost of and increased availability of technology like Arduino & MakerBot, as well as the increased digitalisation of data and the pervasiveness of internet connectivity has started to make the data that previously resided in the shadow available to us. Which means that we can now passively collect data on changes in body temperature, credit card usage the opening refrigerators in realtime.
Introduction
To see if this idea of tapping into the data shadow using readily available technology was feasible—and could produce something useful—I ran an experiment. The aim: passively measure the frequency of tea drinking amongst a convenience sample of one—me.
Method
A Twine from Supermechanical was used to collect the data. A Twine is an electronic box that sensors connect to. It sends data via a wi-fi connection to a website.
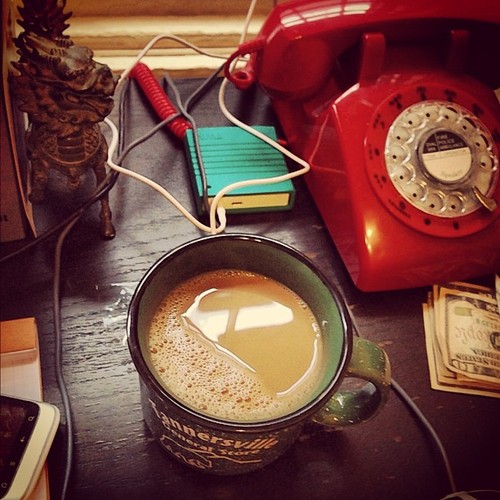
To collect data on tea drinking a magnetic switch was connected to the Twine. And a magnet was attached to the bottom of a Tannersville General Store mug. A receptacle highlighted as the primary tea drinking device used by the participant.
Every time the mug was taken on or off the magswitch, the Twine sent a message to a website, which passed the signal on to another website, which formatted the data and placed in a Google Spreadsheet for storage and analysis.
Tea drinking data was collected over a 3 day period in November 2012.
Results
The summary results are divided into two sections. Mug level results associated with drinking of the mug of tea as a whole; and Sip level results related to individual sips of tea. There being multiple sips per mug.
Mug level
| Metric | Value |
|---|---|
| Cups per day | 3.3 |
| Time to drink a cup | 36:26 |
Sip level
| Metric | Value |
|---|---|
| Sips per cup | 11.2 |
| Time per sip | 0:06 |
Conclusions
The experiment succeeded in accessing data that was inaccessible before e.g. number of sips per mug of tea. Which in turn gave us a accurate description of tea drinking behaviour which would be difficult to obtain by other means.
This approach has the advantage of capturing behavioural data at a level of accuracy and detail which surpasses that of self report data.
However, while the approach is good at capturing what is happening, it tells you very little about why. I’d recommend partnering it with other approaches. E.g. Using the data from the Twine to help design a qualitative discussion guide You drink more tea on a Monday, why is that? or trigger a mobile survey when the Twine is triggered.